TORONTO AIRBNB SNAPSHOT
Toronto’s Airbnb market doesn’t stop at neighbourhood lines.
15,809 listings. One connected market. See how proximity, ownership, and similarity reshape the city beyond its official boundaries.
- Listings
- 15,809
- Official Areas
- 140
- Communities
- 17
- Components
- 1
01 · BUILD THE NETWORK
Three views of the same market
Relationships are added one layer at a time to isolate how geography, host ownership, and listing similarity reshape the network.
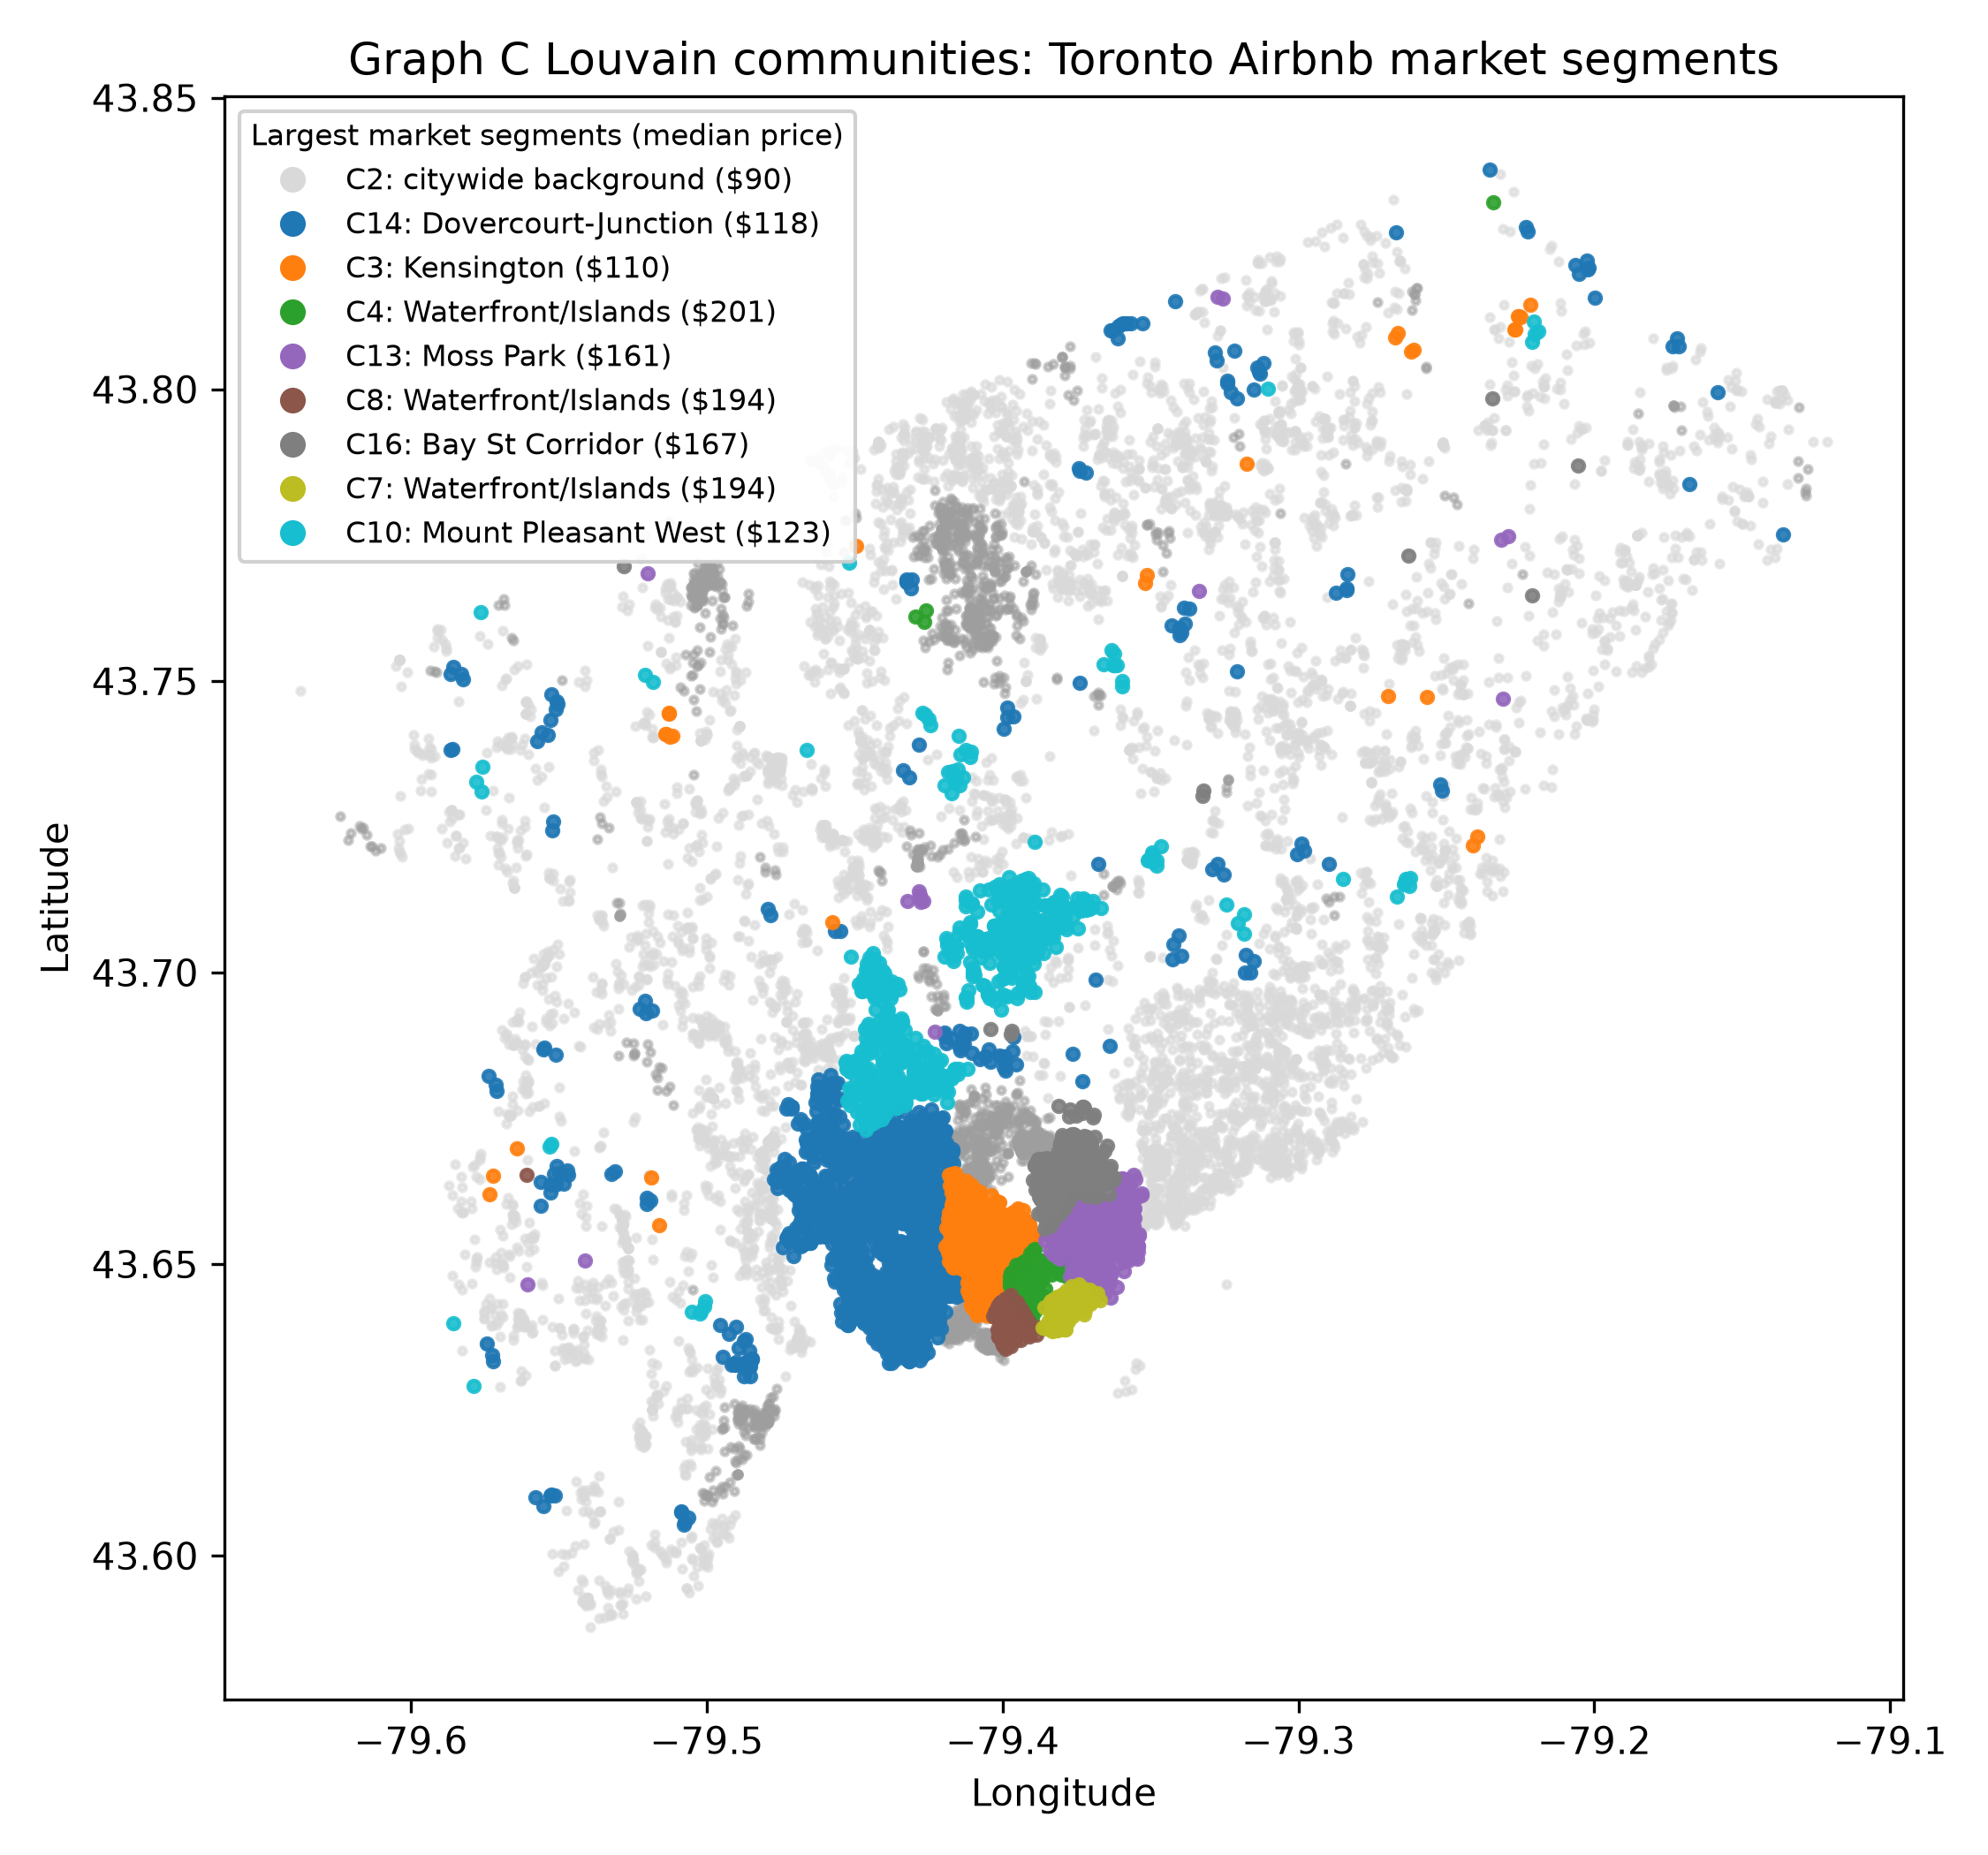
Similarity links connect the entire city into one component and a small number of broad market segments that cross administrative lines.
| Graph Variant | Nodes | Edges | Components | Largest Comp | Avg Degree | Modularity | Neighbourhood NMI |
|---|---|---|---|---|---|---|---|
| Graph A: Spatial only | 15,809 | 1,552,469 | 100 | 87.8% | 196.4 | 0.8051 | 0.7494 |
| Graph B: Spatial + shared host | 15,809 | 1,555,991 | 53 | 98.7% | 196.8 | 0.8069 | 0.7030 |
| Graph C: Full market network | 15,809 | 1,607,040 | 1 | 100.0% | 203.3 | 0.7926 | 0.5182 |
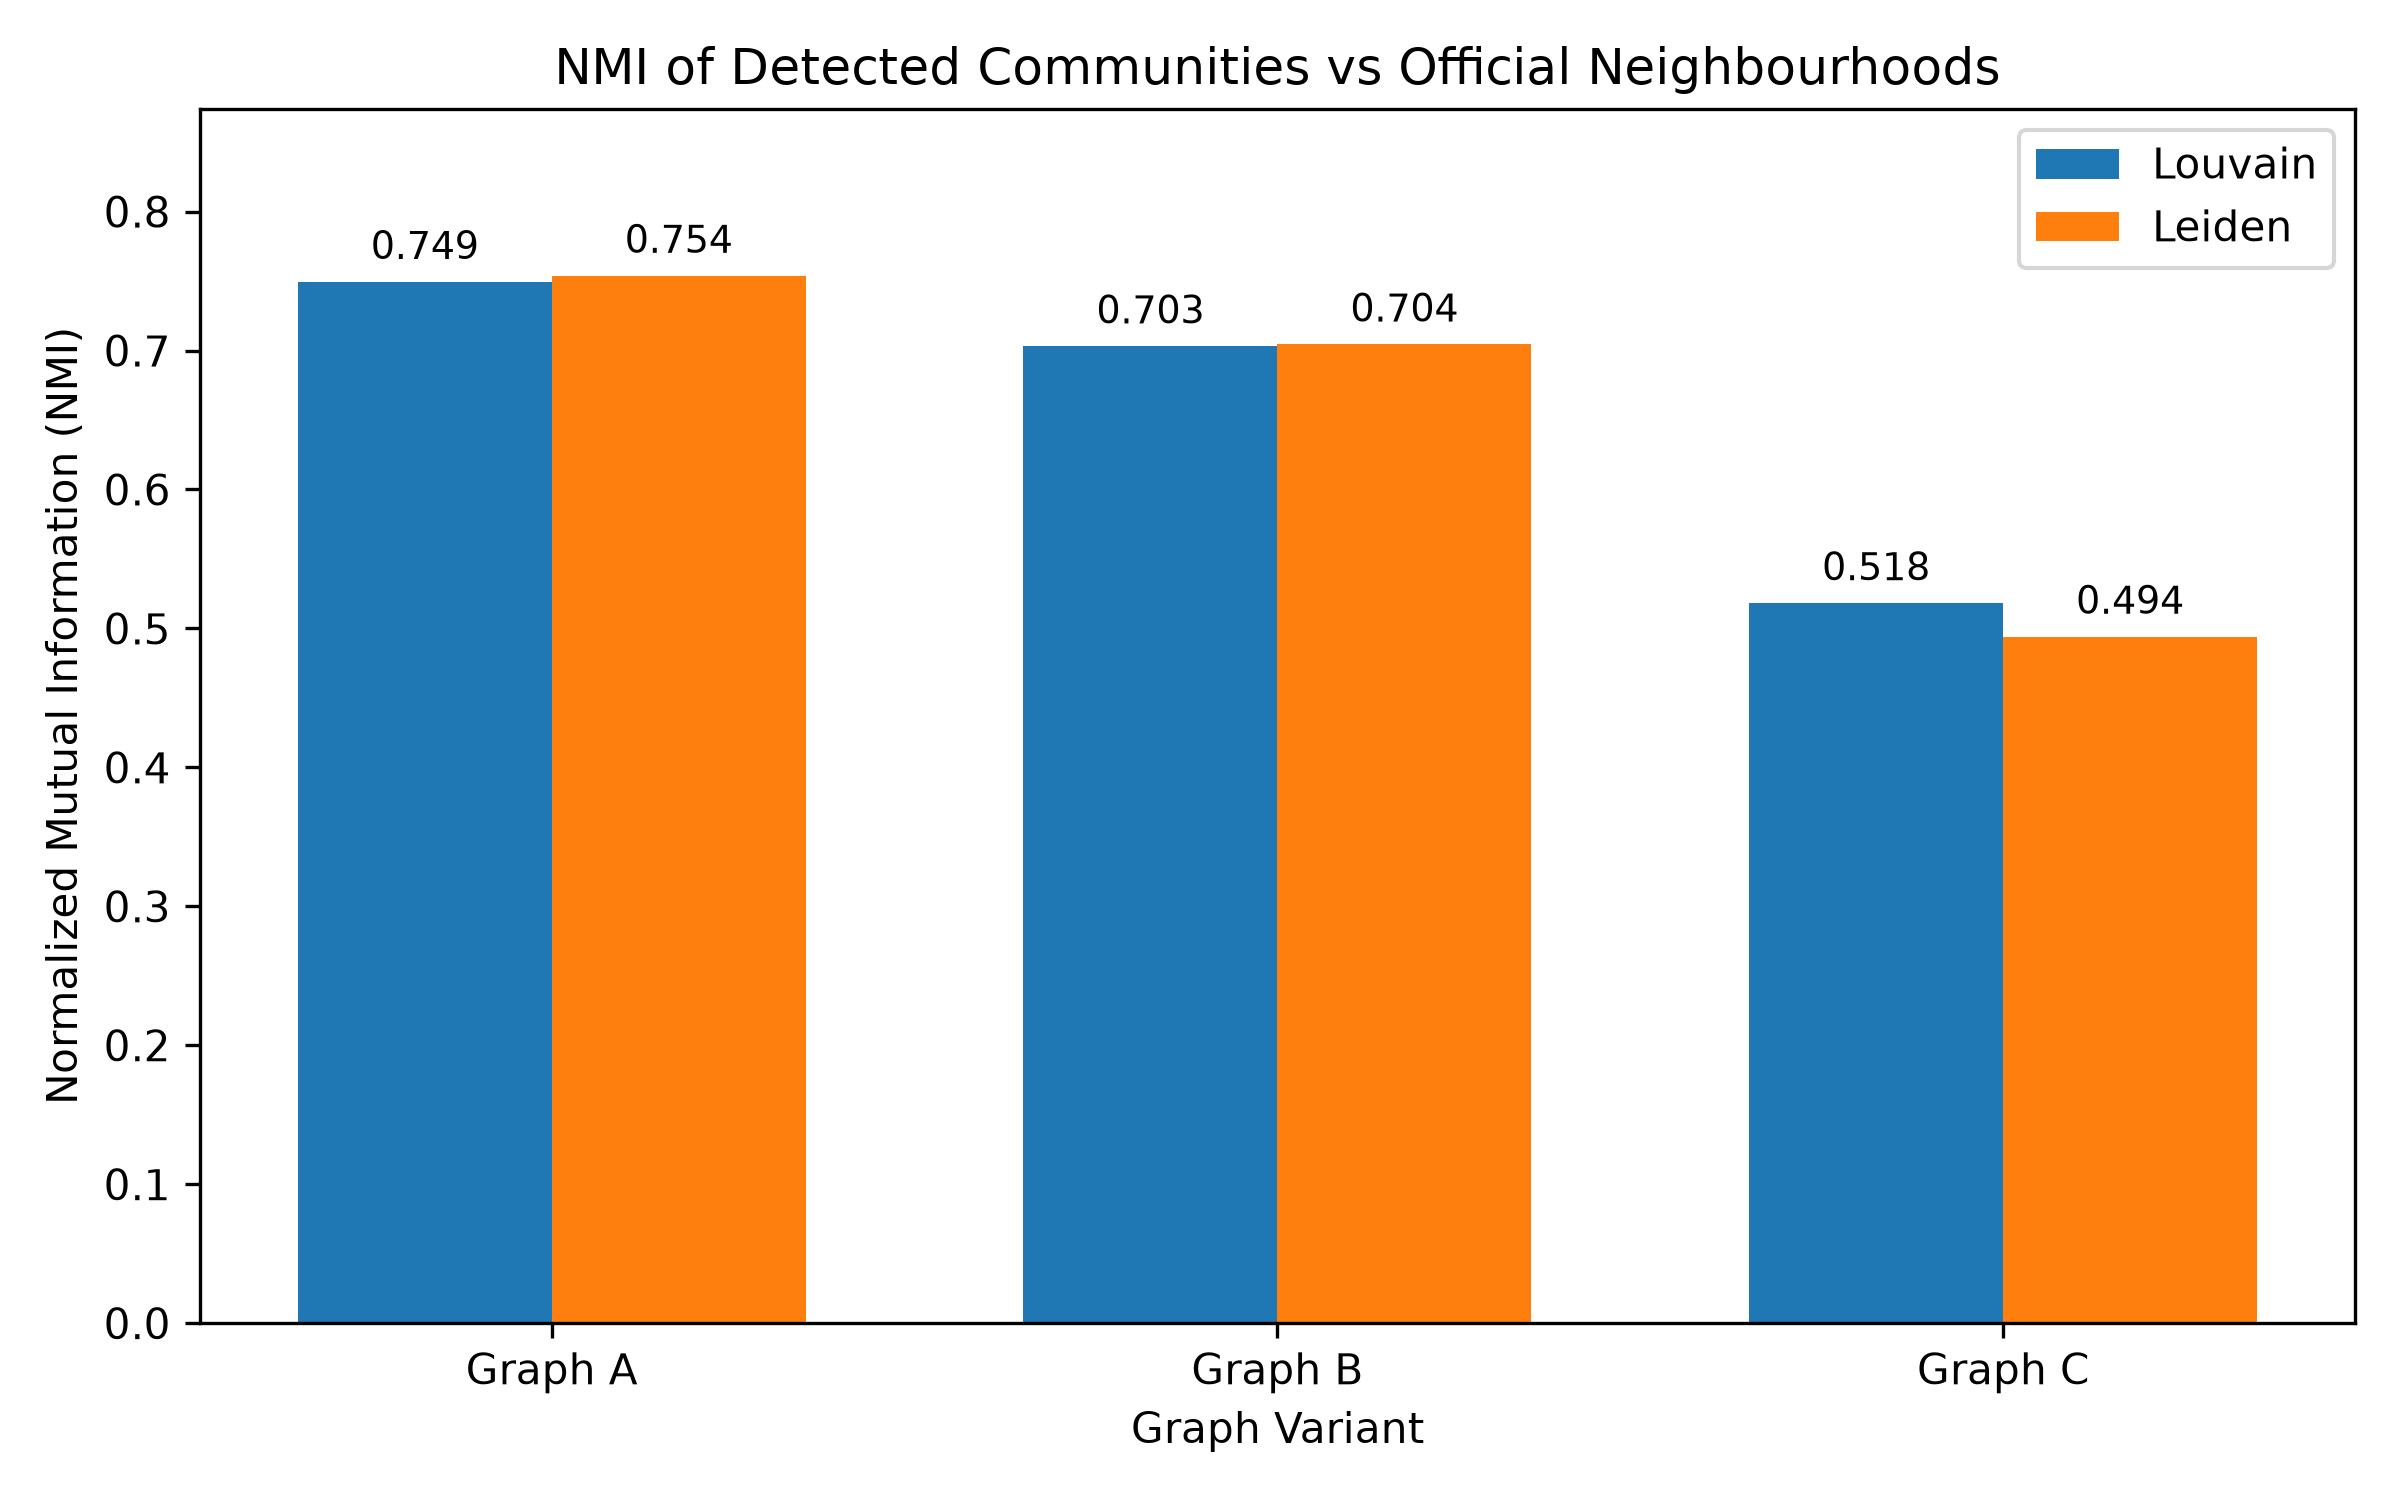
100 components become one. A relatively small set of non-spatial attribute-similarity links bridges disparate geographic pockets into a single unified market network.
02 · DETECT COMMUNITIES
One market, multiple defensible partitions
Louvain and Leiden agree on strong modular structure, but community IDs and exact membership remain algorithm-dependent.
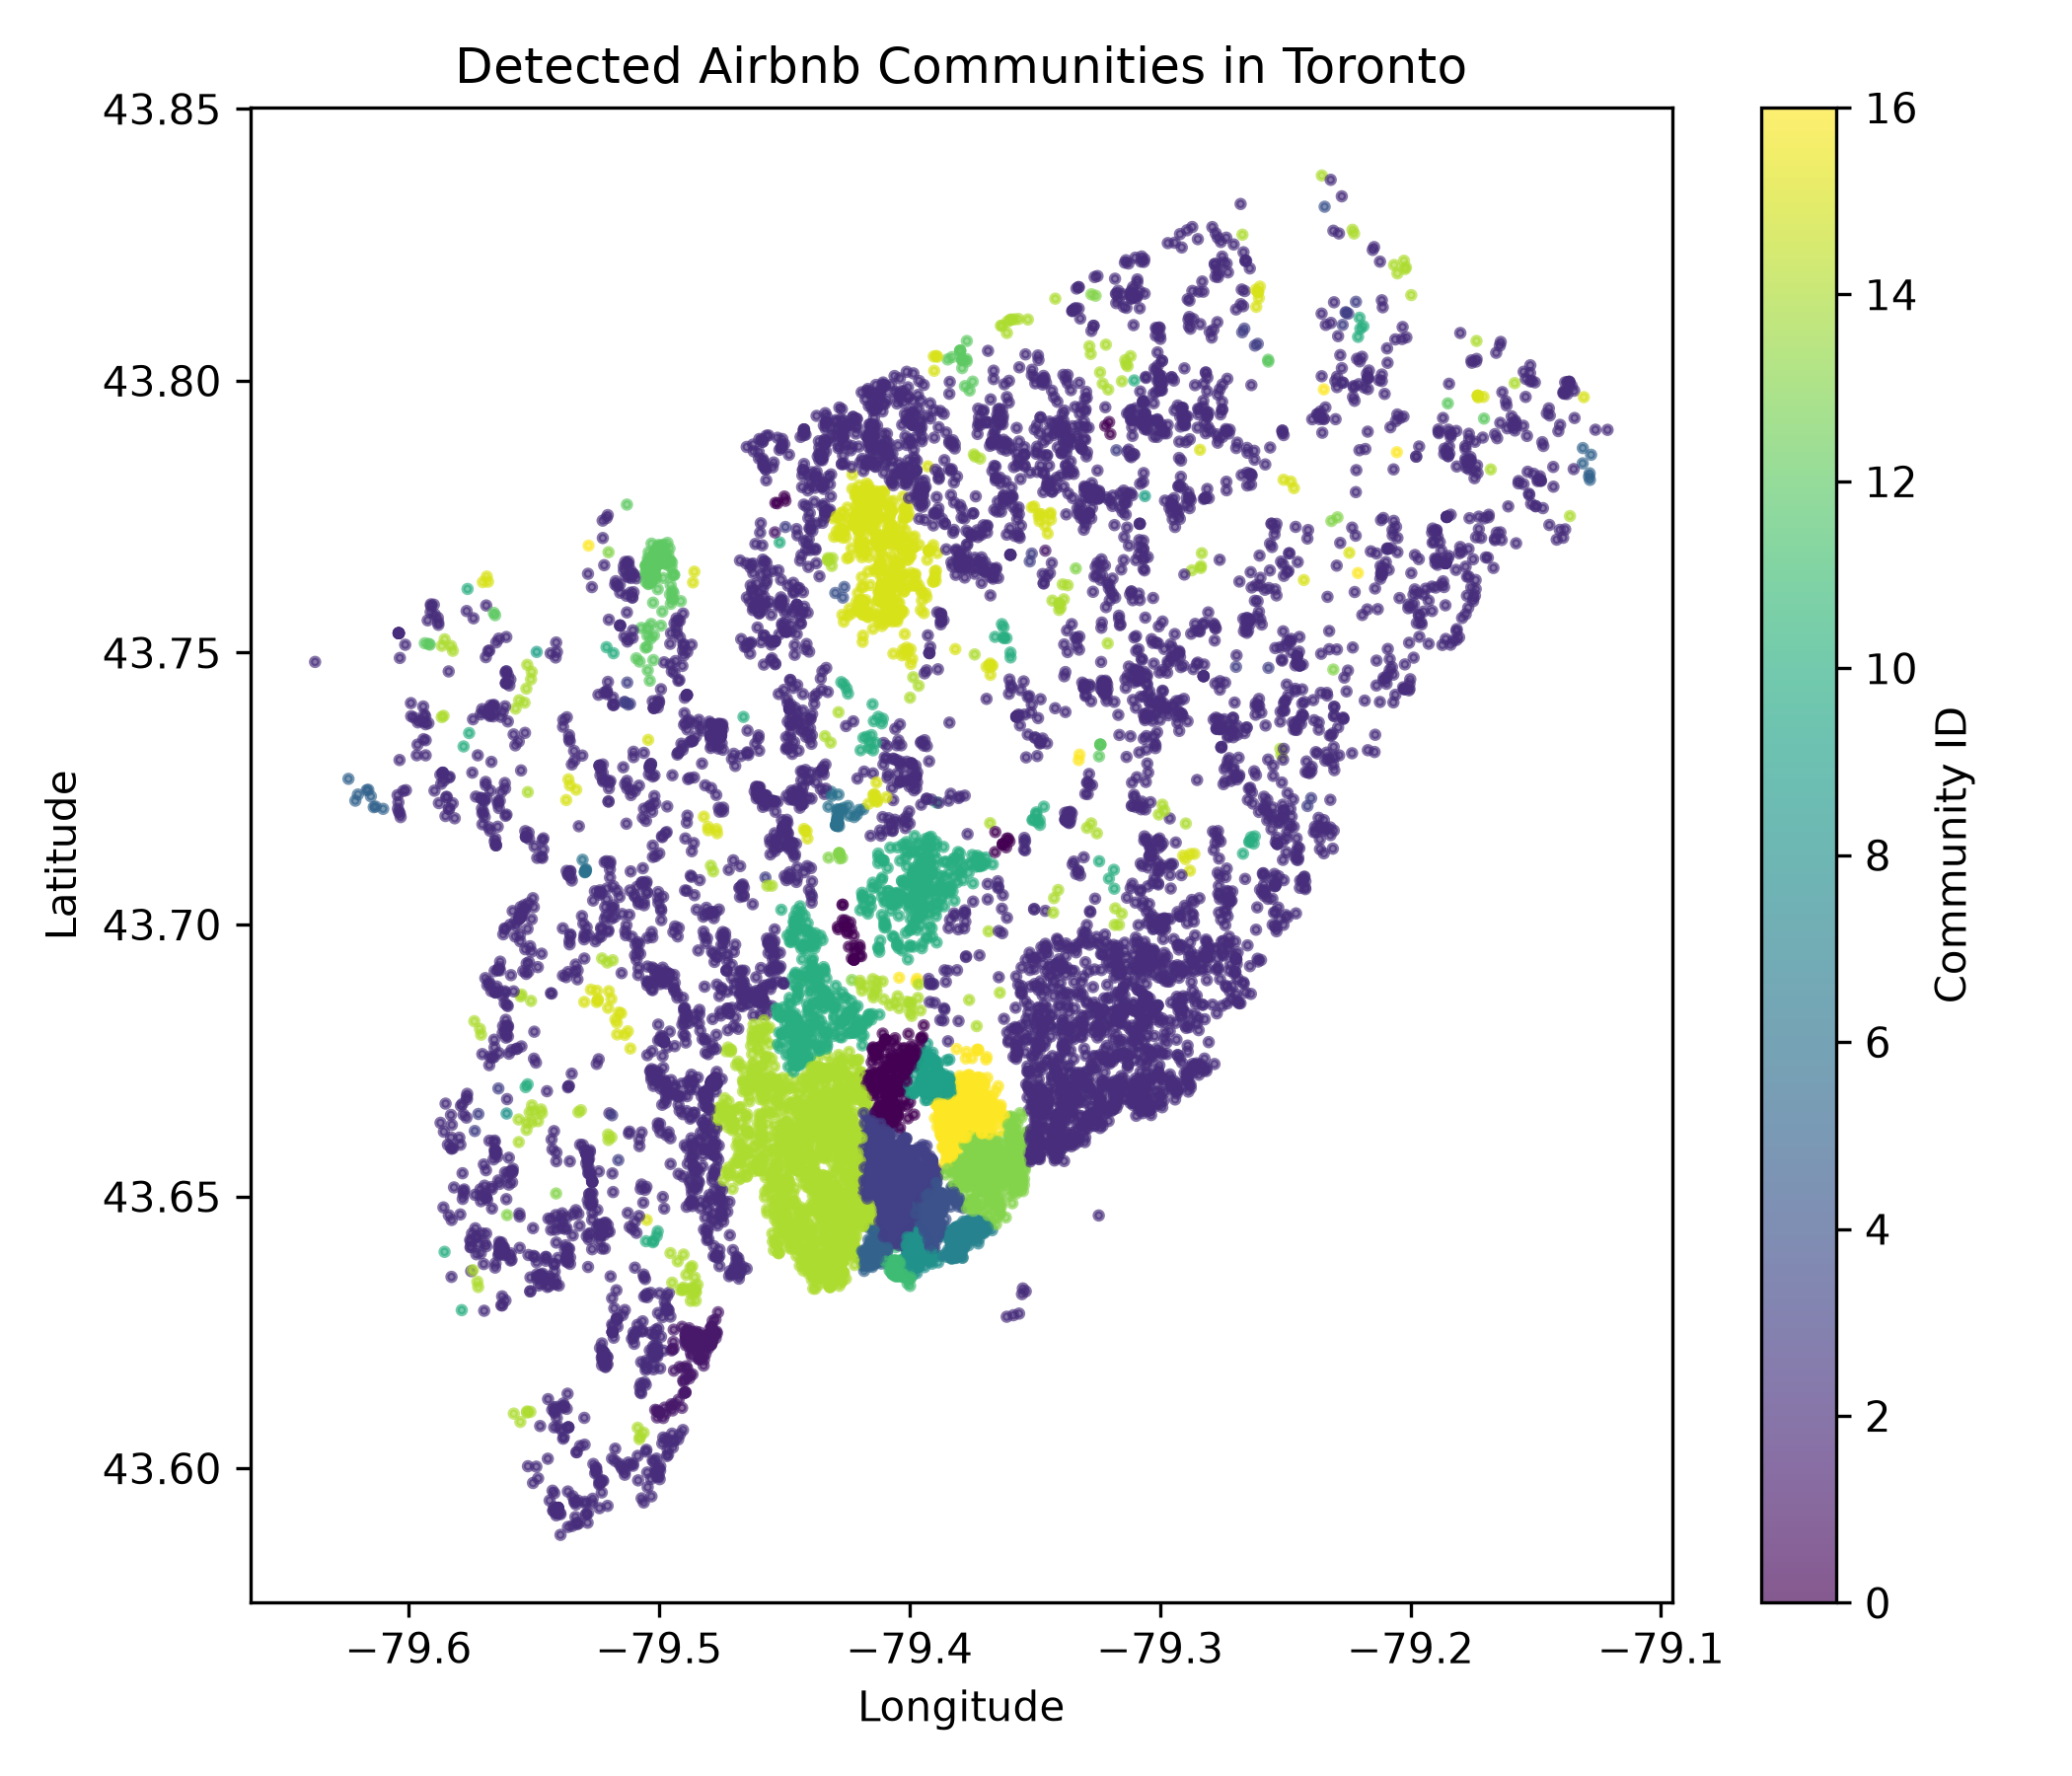
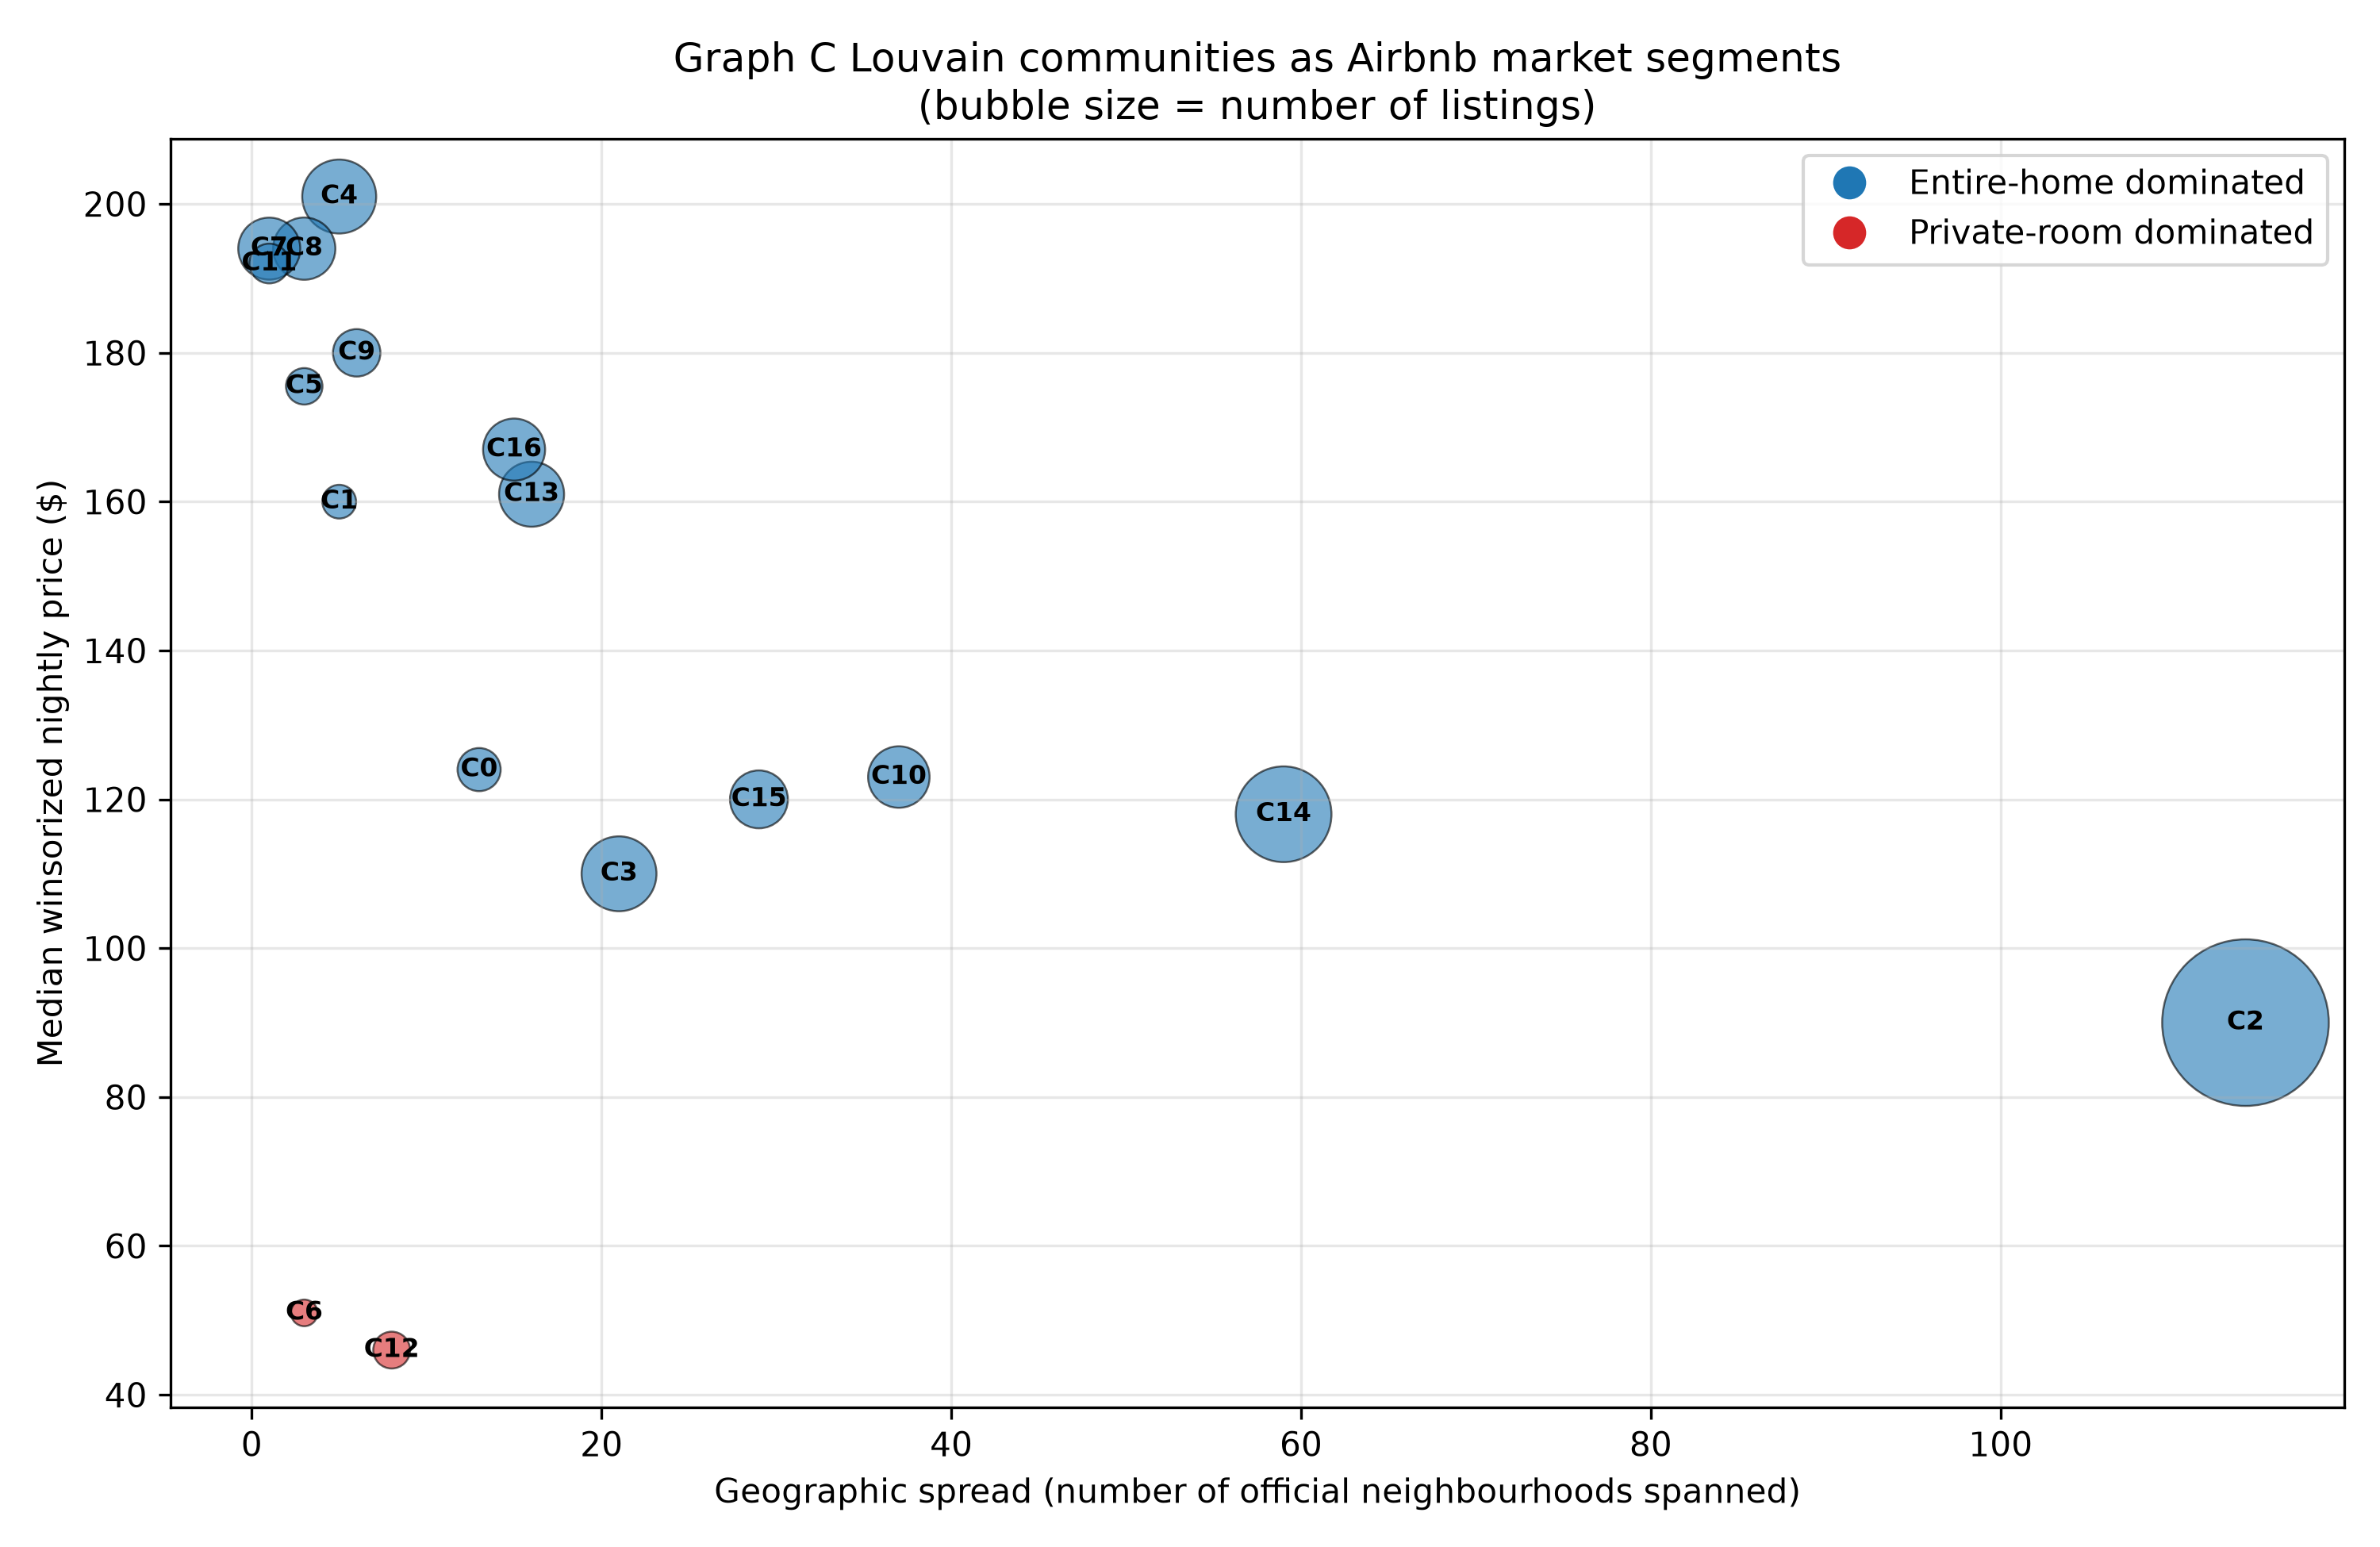
Primary interpretation method: recovers one large citywide background market plus a set of structured local and boutique segments.
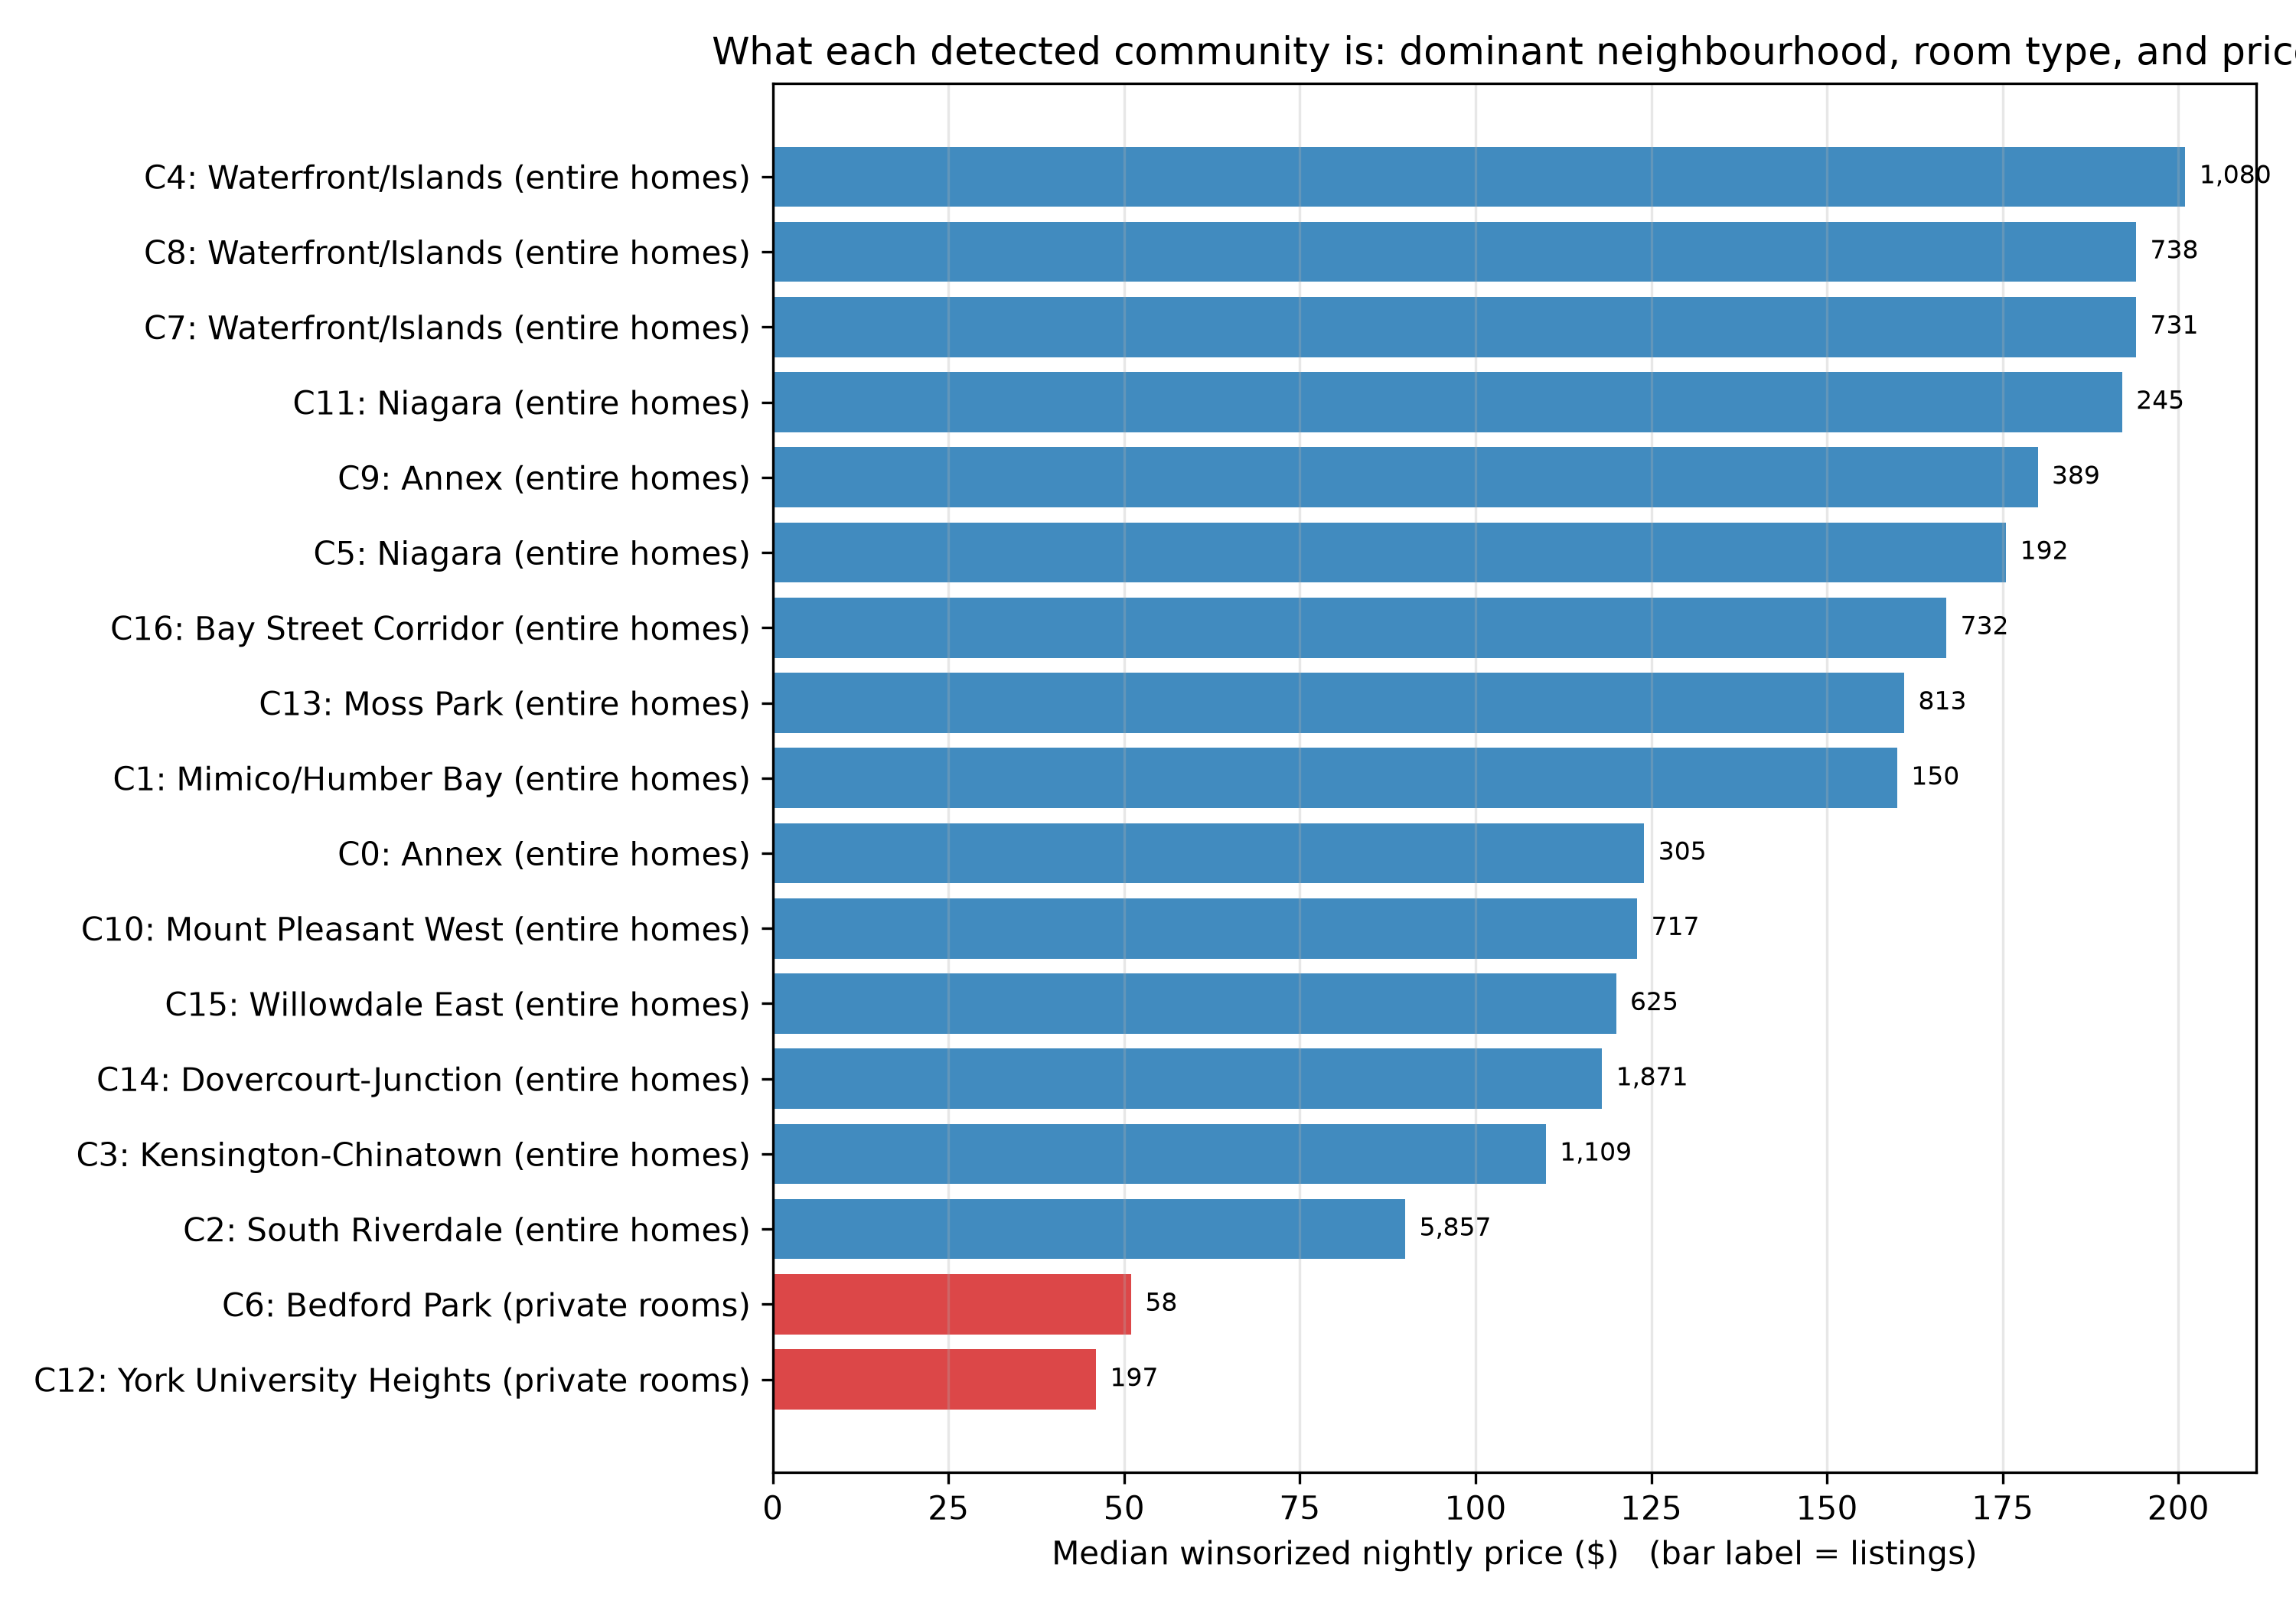
Lower-priced entire homes spread across 114 official neighbourhoods.
High-density waterfront luxury condos with high local concentration.
Dispersed private room clusters near campuses and peripheral zones.
| Community ID | Listings | Median Price | Dominant Neighbourhood | Dominant Room Type | Neighbourhoods Spanned |
|---|---|---|---|---|---|
| C2 | 5,857 | $90 | South Riverdale | Entire home/apt | 114 |
| C14 | 1,871 | $118 | Dovercourt-Wallace Emerson-Junction | Entire home/apt | 59 |
| C3 | 1,109 | $110 | Kensington-Chinatown | Entire home/apt | 21 |
| C4 | 1,080 | $201 | Waterfront Communities-The Island | Entire home/apt | 5 |
| C13 | 813 | $161 | Moss Park | Entire home/apt | 16 |
| C8 | 738 | $194 | Waterfront Communities-The Island | Entire home/apt | 3 |
| C16 | 732 | $167 | Bay Street Corridor | Entire home/apt | 15 |
| C7 | 731 | $194 | Waterfront Communities-The Island | Entire home/apt | 1 |
03 · TEST THE CLAIM
Does the network improve price prediction?
Paired 5-fold cross-validation separates a small raw association from a genuinely useful predictive gain.
Every host stays strictly in train or test (zero host overlap, verified per fold), so the association is not host leakage.
| Validation Scheme | Baseline R² | Expanded R² | Mean ΔR² | Mean Δ Adjusted R² | Baseline MAE ($) | Expanded MAE ($) | Mean ΔMAE ($) |
|---|---|---|---|---|---|---|---|
| Random 5-Fold Cross-Validation | 0.6341 | 0.6358 | +0.0017 | −0.0004 | $55.91 | $55.73 | −$0.18 |
| Host-Grouped 5-Fold Cross-Validation | 0.6246 | 0.6262 | +0.0016 | −0.0007 | $56.32 | $56.18 | −$0.14 |
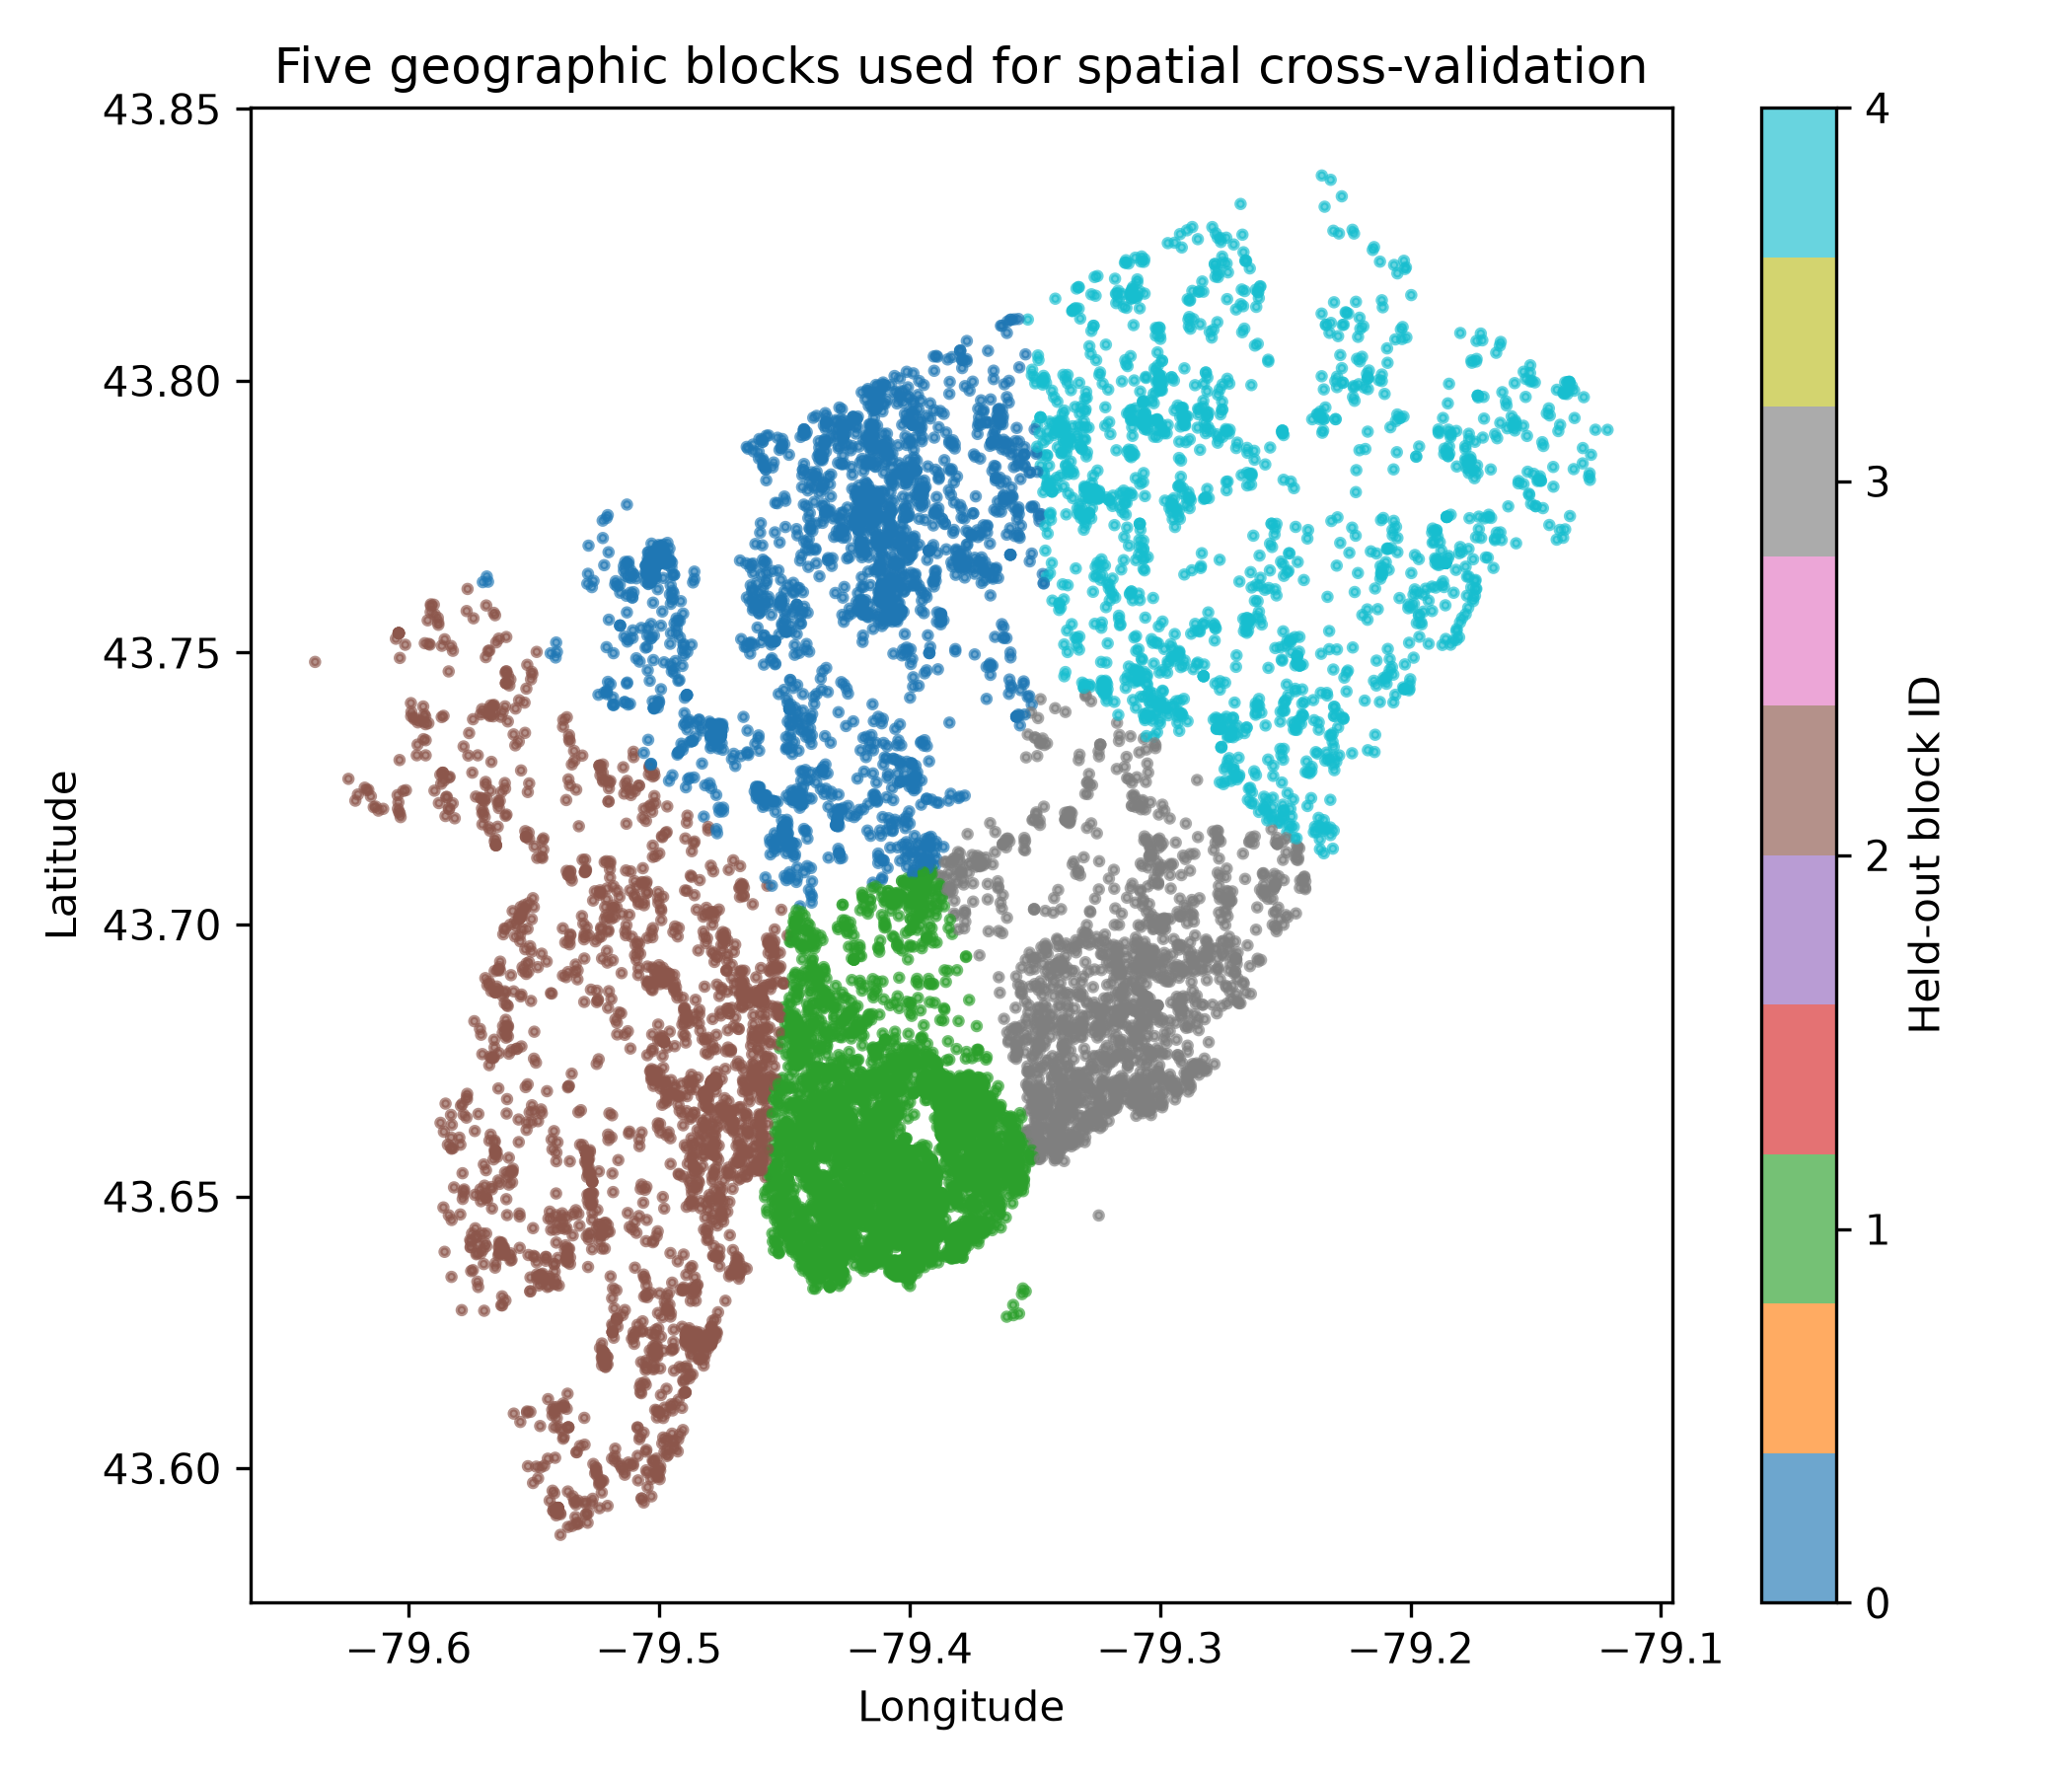
| Spatial-Block 5-Fold Cross-Validation | 0.5290 | 0.5314 | +0.0024 | −0.0010 | $52.26 | $51.83 | −$0.43 |
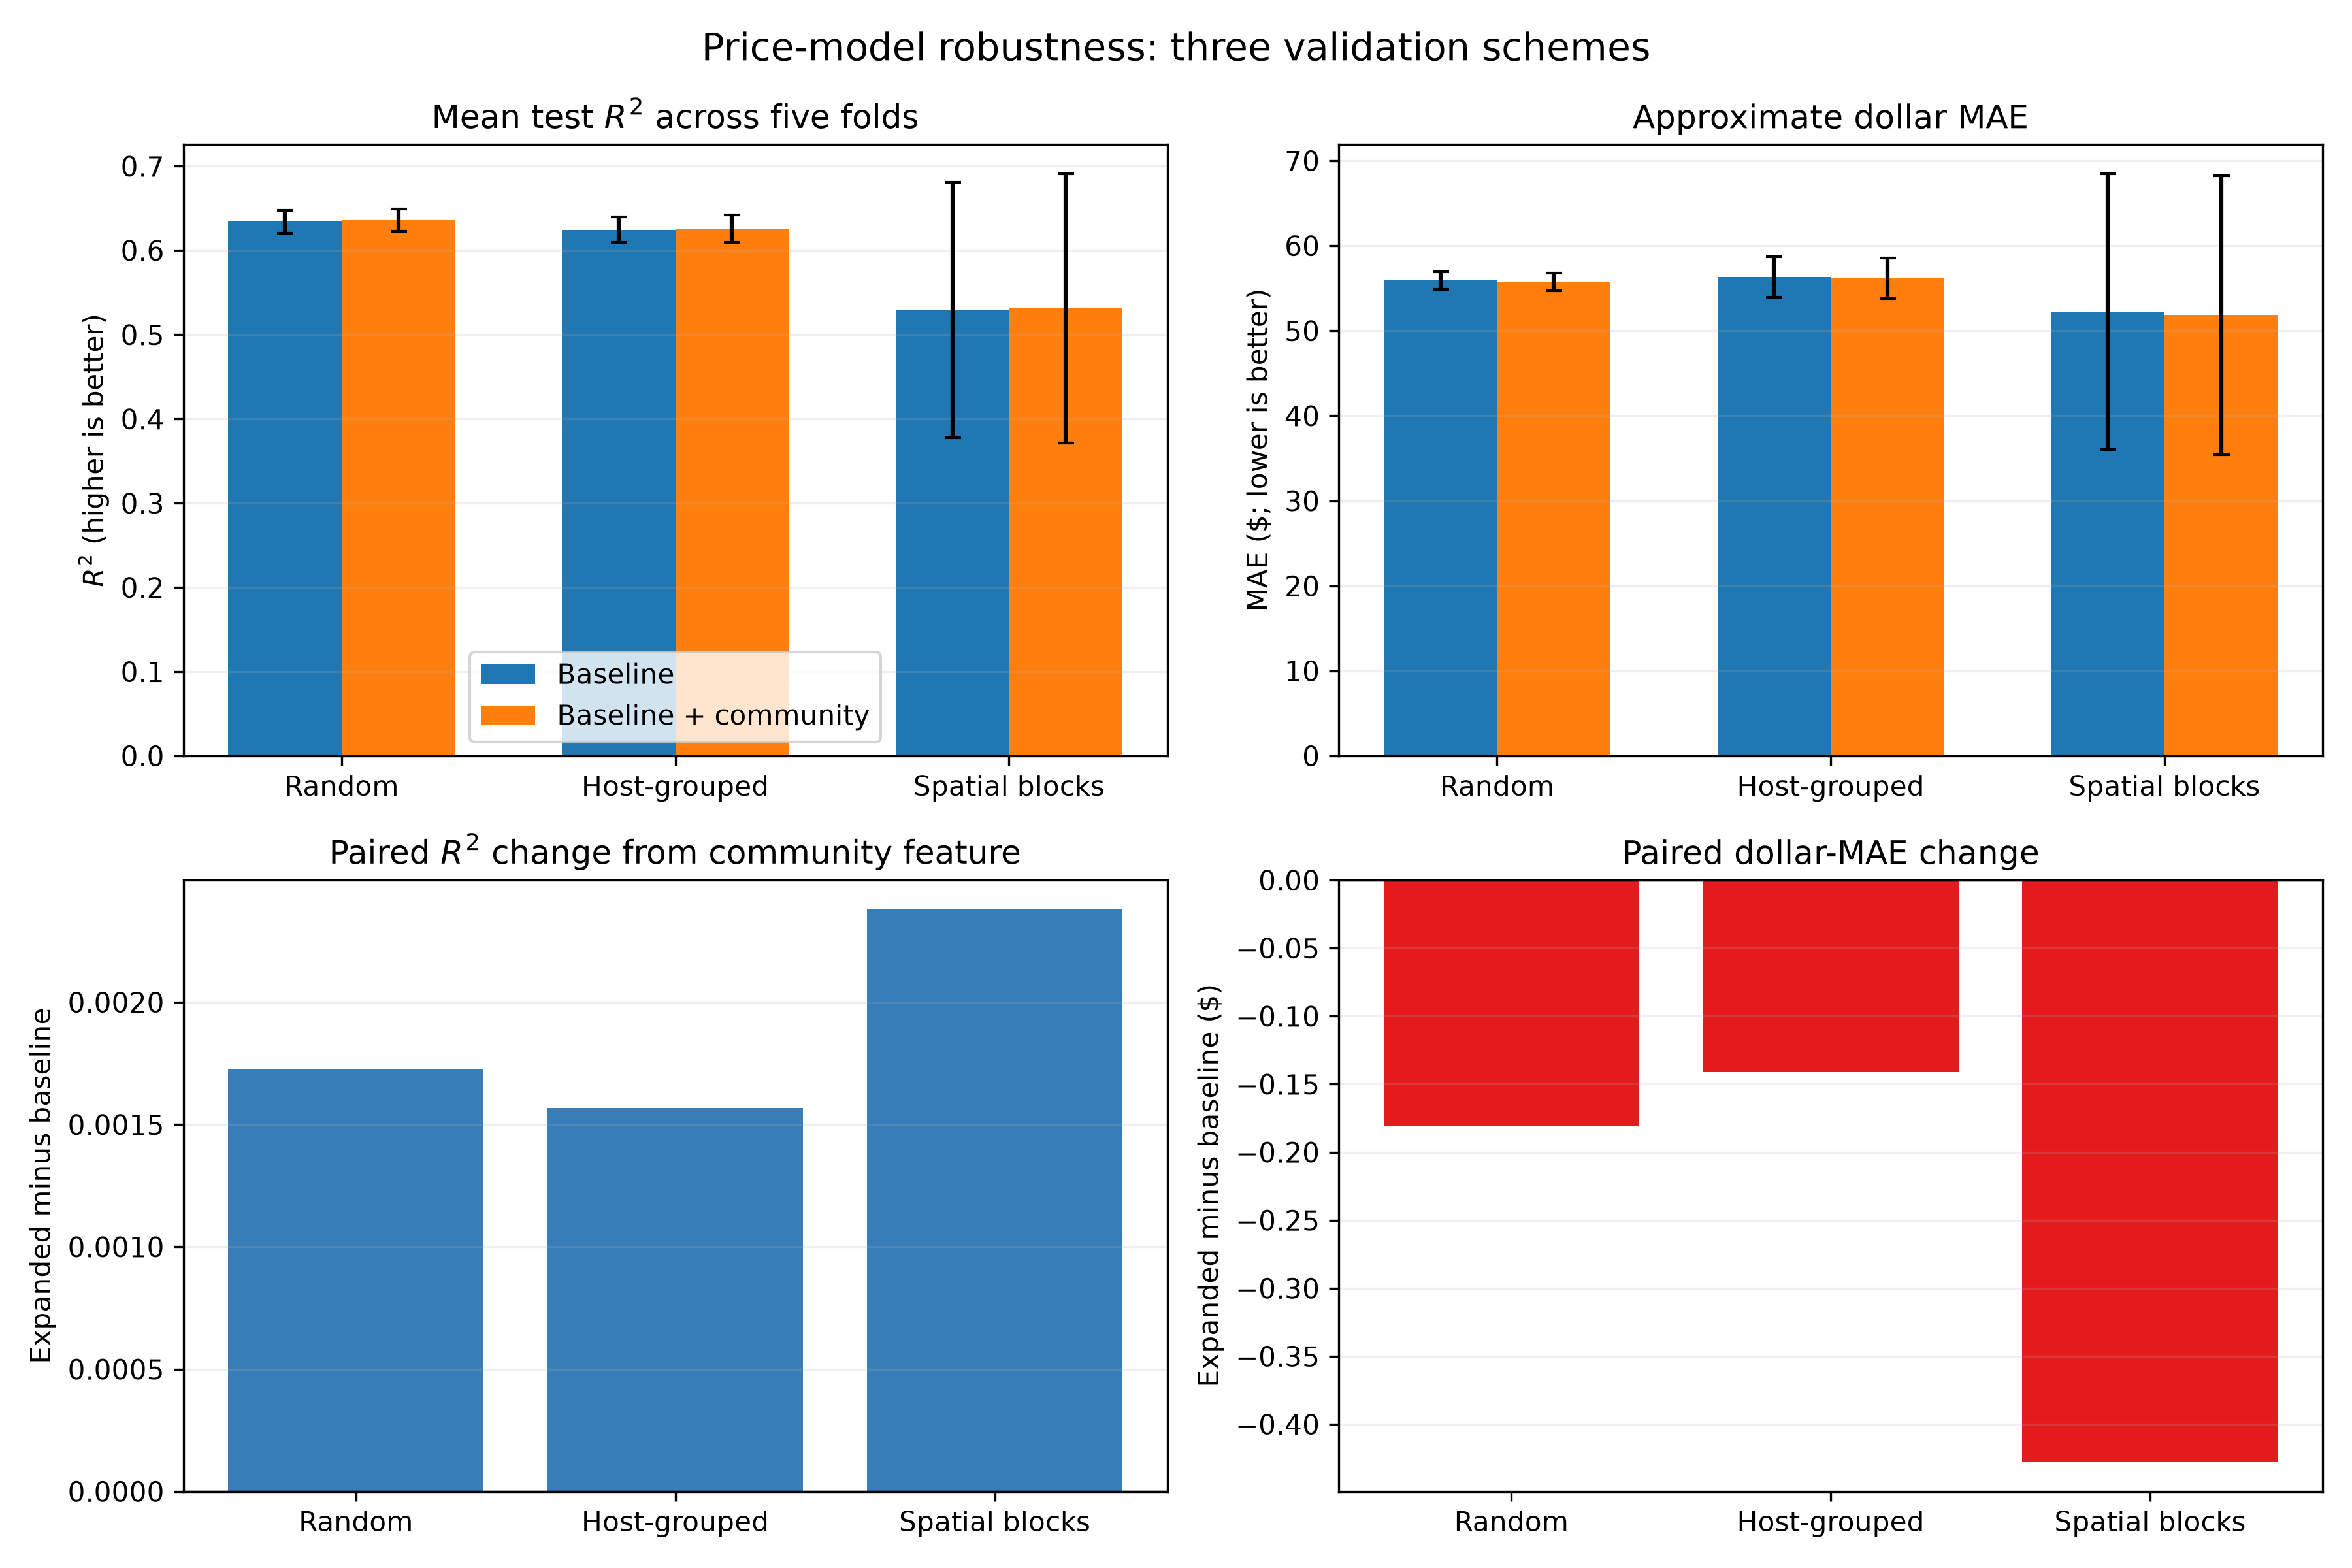
A real signal, but not a material pricing boost. The network community labels provide real statistical signal over random partitions across all cross-validation schemes (random, grouped, and spatial), but yield only a minimal lift in out-of-sample R squared (+0.0016 to +0.0024). Because the effect size is so modest, the network structure is useful for understanding market clusters rather than improving production pricing models.
The original evaluation was flawed because the complexity-adjusted $R^2$ metric systematically penalized any 17-level category, even random noise, by improperly mixing in-sample penalties with out-of-sample scores. We resolved this by switching to a permutation test and paired fold-level intervals for a more reliable assessment.
04 · PARAMETER SENSITIVITY
The broad structure persists; exact boundaries move.
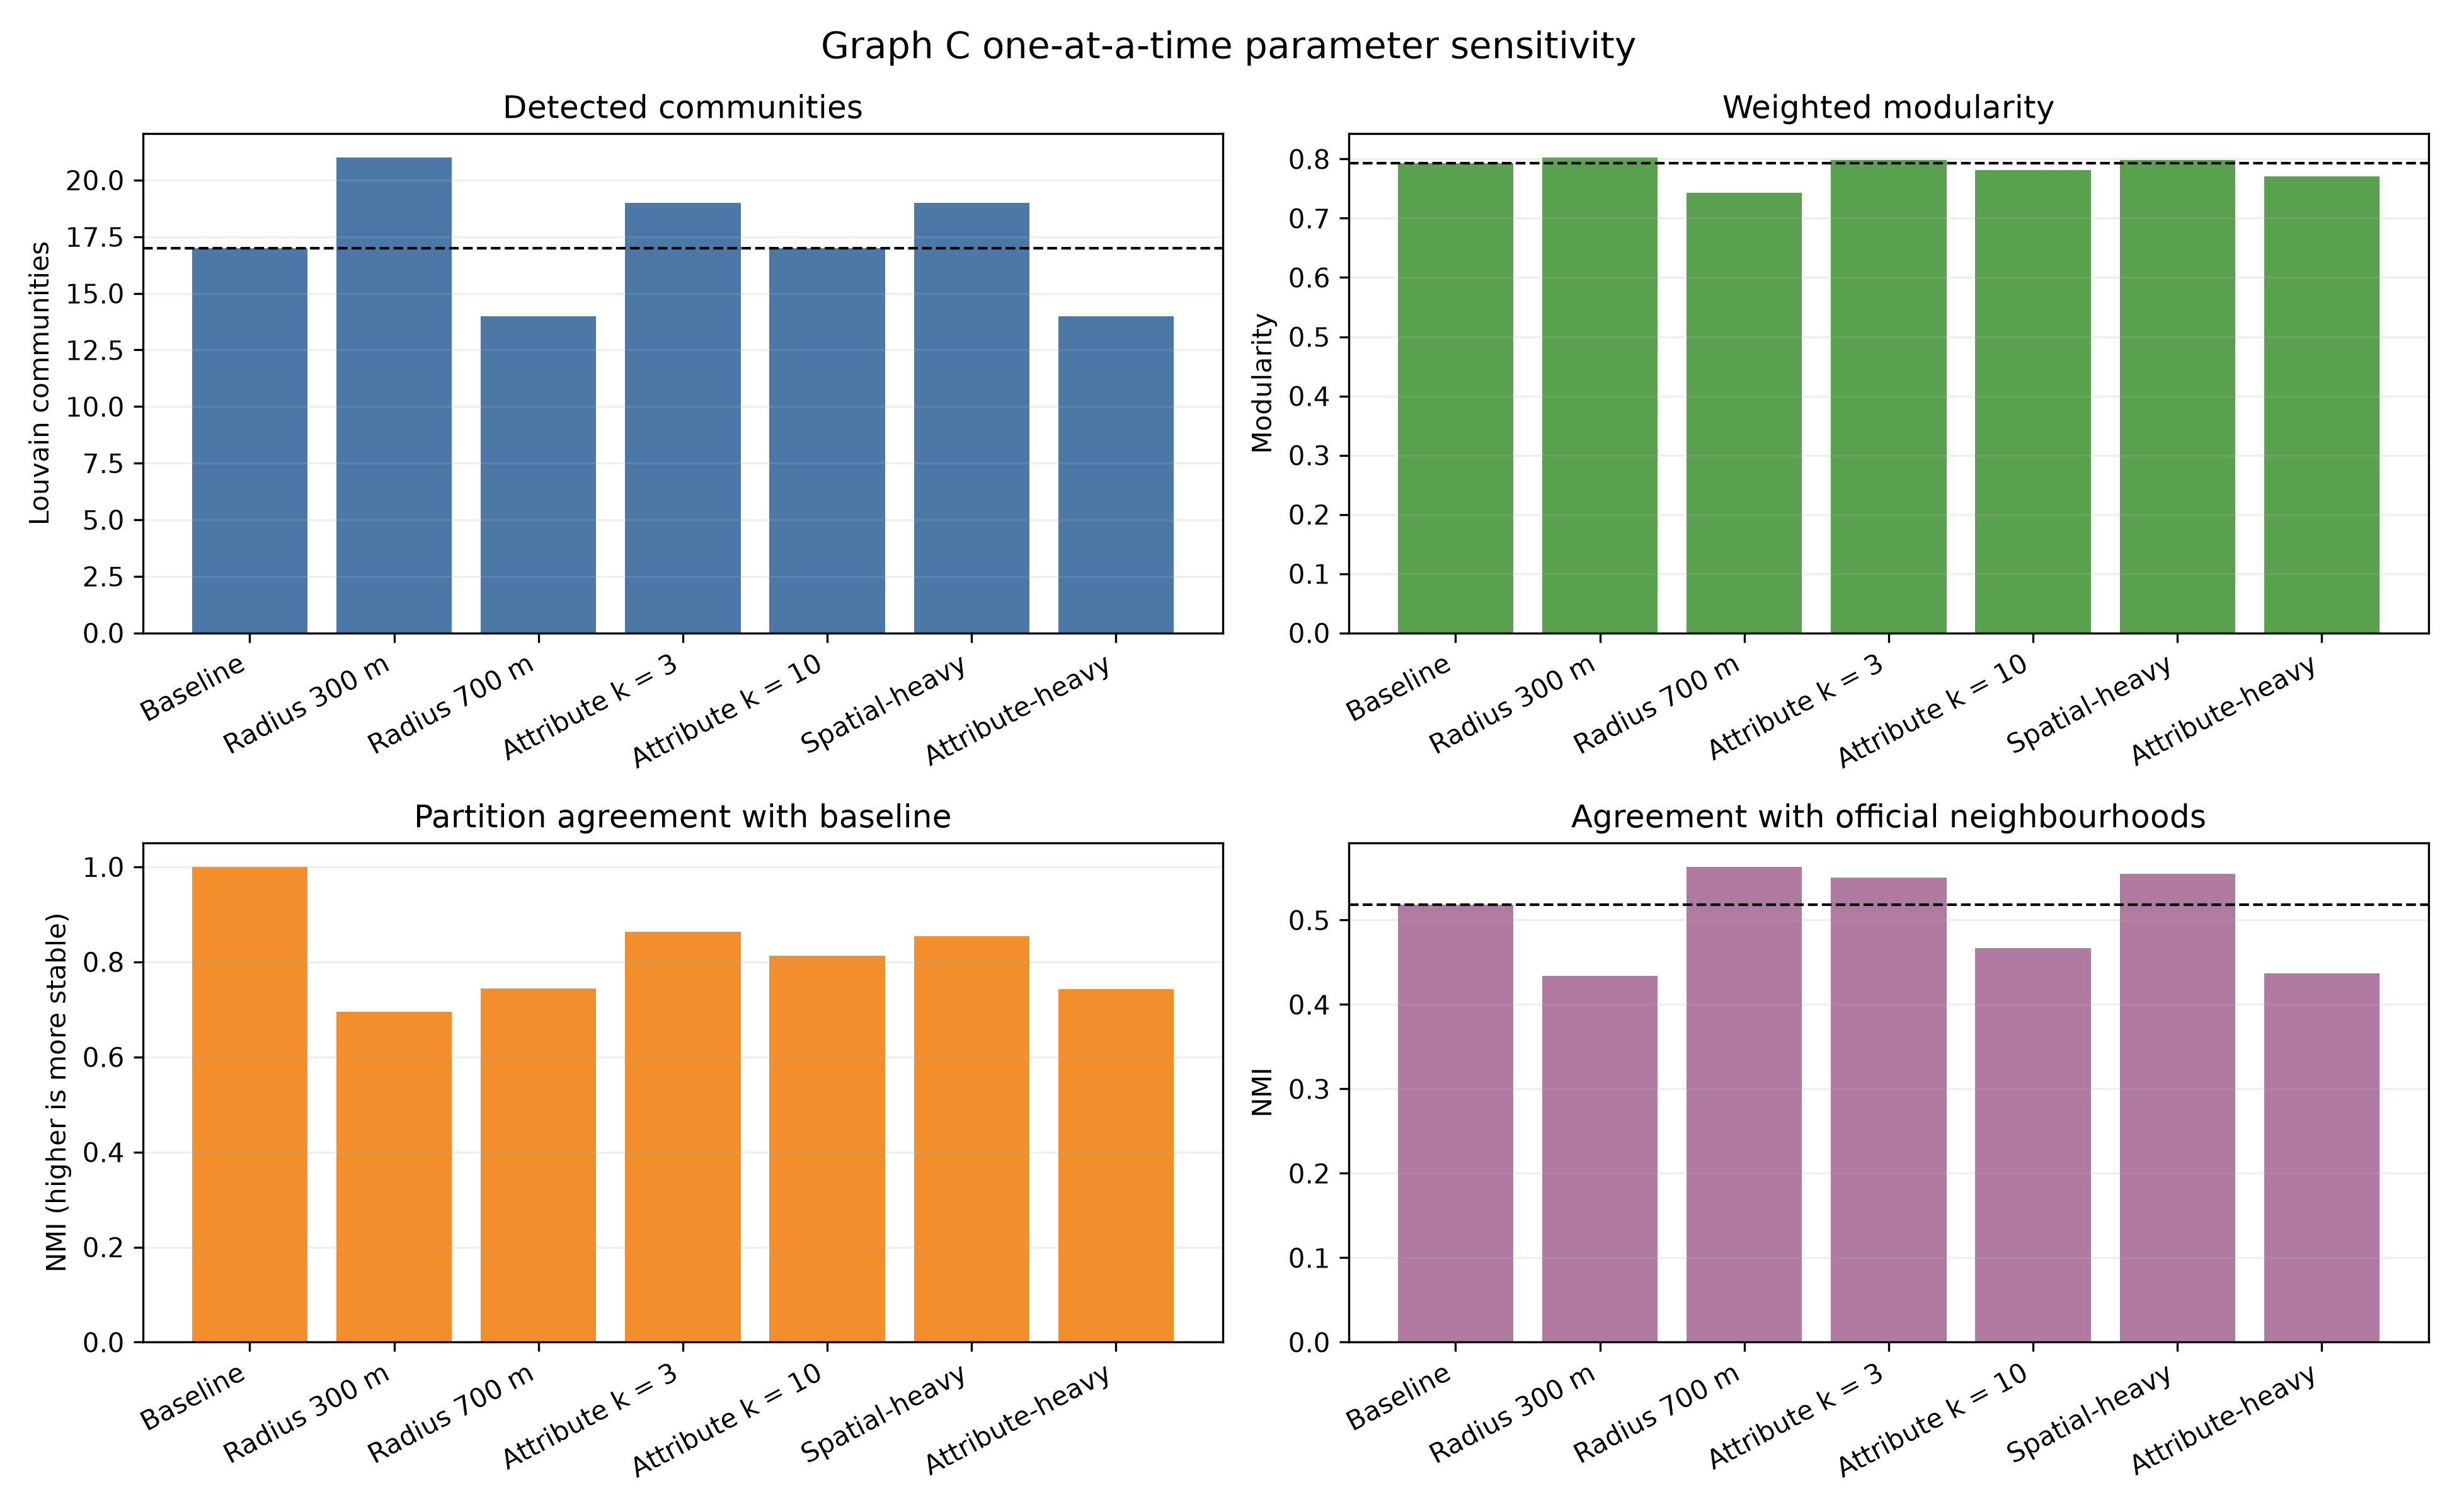
Seven reasonable Graph C parameter settings demonstrate that while modular citywide segments always emerge, exact community assignments are parameter-dependent.
Configuration: Baseline
17 Communities DetectedStandard setup: 500 m spatial radius, attribute k = 5, and 0.60/0.25/0.15 weights.
| Configuration | Radius | Attribute k | Edge Weights (Spatial / Host / Attr) | Communities | Modularity | NMI vs Baseline | Neighbourhood NMI |
|---|---|---|---|---|---|---|---|
| Baseline | 500 m | 5 | 0.60 / 0.25 / 0.15 | 17 | 0.7926 | 1.0000 | 0.5182 |
| Radius 300 m | 300 m | 5 | 0.60 / 0.25 / 0.15 | 21 | 0.8025 | 0.6945 | 0.4340 |
| Radius 700 m | 700 m | 5 | 0.60 / 0.25 / 0.15 | 14 | 0.7430 | 0.7438 | 0.5631 |
| Attribute k = 3 | 500 m | 3 | 0.60 / 0.25 / 0.15 | 19 | 0.7981 | 0.8631 | 0.5506 |
| Attribute k = 10 | 500 m | 10 | 0.60 / 0.25 / 0.15 | 17 | 0.7819 | 0.8136 | 0.4668 |
| Spatial-heavy | 500 m | 5 | 0.75 / 0.15 / 0.10 | 19 | 0.7983 | 0.8541 | 0.5550 |
| Attribute-heavy | 500 m | 5 | 0.45 / 0.20 / 0.35 | 14 | 0.7702 | 0.7429 | 0.4366 |
05 · RESEARCH INTEGRITY
Reproducible by design
The portfolio refresh turns a course submission into an auditable case study with locked dependencies, automated unit tests, generated canonical artifacts, and honest scope limitations.
Inside Airbnb Snapshot
November 2025 public Toronto data: 15,809 cleaned listings across 140 official neighbourhoods.
No Data Leakage
Graph edges are constructed strictly from spatial proximity, host IDs, and listing attributes. Price never enters graph construction.
Strict 5-Fold Folds
Baseline and expanded models are evaluated on identical random, host-grouped, and spatial-block folds.
Transductive Validation
Evaluation is transductive and based on a single temporal snapshot, so the results describe observed network structure rather than causal or deployment-level effects.
Open the technical methodology
Network Construction: Weighted undirected graphs built with BallTree haversine distance (500 m radius), sparse nearest same-host connections (k=5), and cosine-similarity nearest neighbours (k=5) over standardized numerical and one-hot categorical listing features.
Community Detection: Seeded Louvain and Leiden modularity optimization, evaluated using modularity (Q), Normalized Mutual Information (NMI), and Variation of Information (VI).
Price Modelling: Ridge regression on log-transformed winsorized nightly price, with room types, property types, and official administrative neighbourhoods as the baseline.
Research, analysis, and portfolio presentation by Sourav Chandhok.
Developed from a research project and extended with reproducible analysis, grouped and spatial validation, parameter-sensitivity testing, and this interactive presentation.
THE TAKEAWAY
A market can be geographically local and structurally citywide at the same time.
The value of network analysis lies not only in what it reveals, but in knowing what the evidence cannot support.